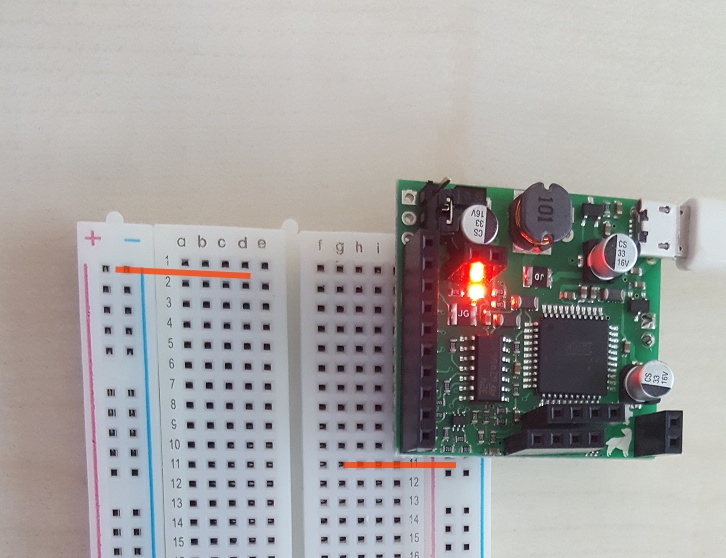
The Labrador, developed sometime around 2016 by Chris Esposito of Espotek, aims to pack a full complement of electronics lab instruments into a bite-sized circuit board at an irresistible price: around 52`000 satoshi by current rates. Of most interest to me was the oscilloscope; I was fairly certain I would need one, but far from certain what features would be most helpful for my present application, how many future applications I would have, or even what country my lab would end up in. Thus I figured I'd go cheap for my first step and find out from there what I actually wanted.
The Labrador's scope offers an underwhelming maximum sampling rate of 750 ksps - plenty enough for audio signal work I suppose - and 8-bit resolution. But it has the distinct advantage of being able to transmit its full data stream over USB for storage and analysis by computer, in addition to the traditional live visualization; and this without demanding some horrid proprietary Windows-only GUI. The product has remained available and in stock, and of course the website features all glowing reviews. So how does it turn out in practice?
My initial response was strongly negative. Documentation is sketchy. The pins didn't line up to fit the intended way in my apparently weird Chinese breadboard. The GUI wouldn't build in any of my graphical Linux environments, as those consider Qt 4 to be quite modern enough, thank you very much; and there's no standard Linux way to just capture its sample data stream,(i) as it seems to use a custom USB-based protocol for the communication. So in practice I was stuck running the Windows binary anyway, and there I found it so buggy I couldn't be bothered to list the ways.
Still, a year later with minimal further progress on my hardware research, and back in Panama with even less chance of finding good equipment to borrow or pick up used, curiosity won out and I gave another try to the tools already at hand. Of course I hit all the same problems and annoyances and then some, so this time I documented and brought them to the designer to give him his chance to respond. In short, he has little love remaining for this old thing, plans to redesign both the hardware and software, but meanwhile isn't going to give much support even for basic, FAQ-level questions. So far he's answered one question, and just getting that far required surmounting some initial defenses. Time takes its toll:
Truth be told, if I'd received the exact same email a couple of years ago I would have been absolutely thrilled to get this much user feedback.
I suppose if he comes back with more I'll update accordingly; otherwise the rest will stay here glaringly open.
Questions
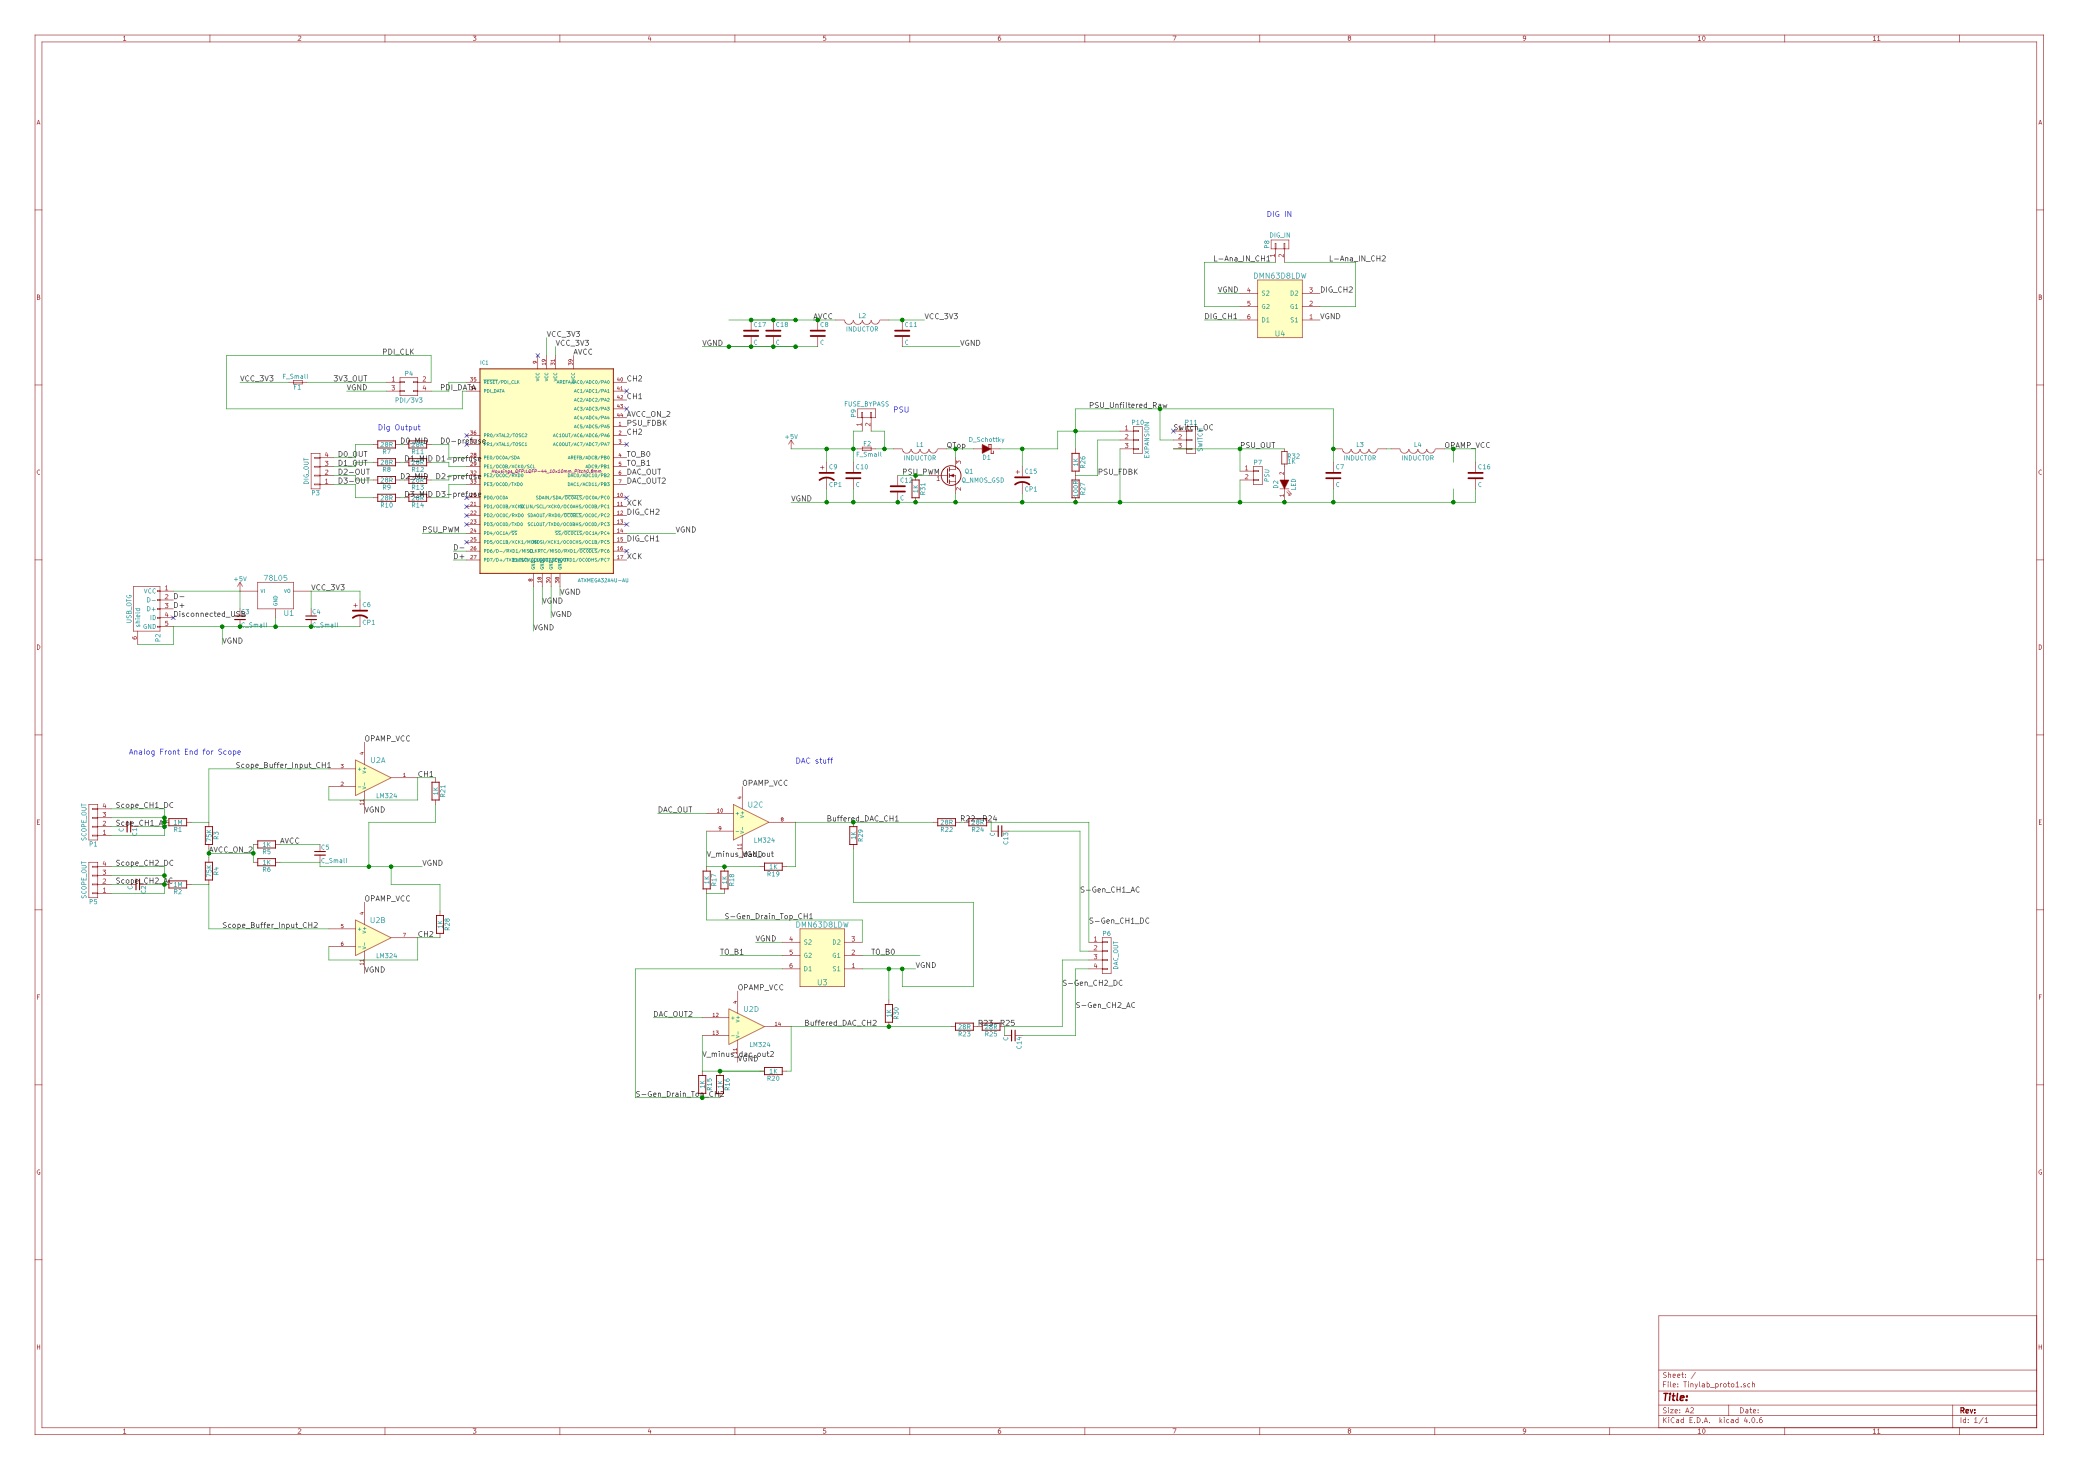
1. Why does the scope input seem to pull towards 1.6V instead of floating? With nothing connected it's a flat line there; when I touch a wire going into CH1 I see a 60Hz, 1.3V peak-to-peak sawtooth triangle wave (guessing this is from a difference in ground between me and the computer) but still centered there. If I use my fingers as a high-valued resistor between CH1 and GND or Vcc it dampens the wave and pulls down or up, respectively, but only slightly. Basically it's like I'm looking into a high-valued voltage divider rather than a truly high-impedance input; at what point might this interfere with measurements?
My own answer, after examining the schematic: this is correct, there's a voltage divider pulling the pre-amp/buffer input to Vcc/2; I'd guess the reason is to allow measuring voltages below ground, given the constraints of operating from a single 5V power supply. The equivalent circuit looking into the scope input is approximately a 1M ohm resistance to Vcc/2 (around 1.6V). Thus a circuit with source impedance upwards of 100k ohm is likely to be altered by the probe.
2. Why does moving my signal from the CH1 DC to CH1 AC input not seem to make any difference, but checking the 'AC coupled' box centers the wave around 0 as expected no matter which physical input it's in?
My own answer: this is likely because on the one hand the signal I was looking at was centered anyway around 1.6V, and on the other the DC offset per question #1 is added after the blocking capacitor, to be able to measure the negative half of the wave; so the function of the checkbox is simply to reverse this offset in software.
3. Why does the timeline read negative with 0 on the right? I guess it kind of makes sense since we can only ever look at data from the past, but I'd have thought 0 should be the beginning of the sweep, or the trigger time. But then...
4. With trigger enabled, where on the timeline is the trigger point? From playing with the time window it seems to stick to the left edge of the screen, i.e. an arbitrary negative t-value; but then if I ctrl-scroll with the mouse it doesn't "stick", nor does 0 stick to the right, so I have no idea where it is.
5. How many samples are held in memory? Is it always the same? It seems you can "zoom out" quite a ways even after pausing, and this data is filled in from the left. Does that mean you can see pre-trigger data?
6. What are the units for the trigger level control or what does it mean? In particular with AC coupling I can't seem to get it to trigger at the expected level.
My own answer, after poking with some more predictable signals: they seem to be in volts; the confusion is because it refers directly to the voltage measured by the buffer amp; in AC coupled mode this is past the blocking capacitor, where the signal is re-centered around ~1.6 V, per question #1.
7. I know the samples are 8 bit, but what voltage range do they cover? Am I correct that reducing the Vmin to Vmax range doesn't improve precision, but increasing the gain does?
8. What interpolation is used to draw the plot? Sometimes I see a strong "pixellated" / squared-off / stair-step look to the waves but not sure if that's just how they're drawn or it's the quantization error or what.
9. What limits the sample rate to 750k? From first looks at the AVR XMEGA documentation, its ADC is supposed to do up to 2Msps, even at 12-bit resolution if I read rightly.
10. What am I looking at when exporting data with "Take Snapshot"? For one, I'm seeing lots of duplication in both t- and v-values, though not exactly in sync; it's like there's both some undue rounding and re-sampling going on, or something. And they seem to be ordered backwards in time. Do the points correspond to what's shown on screen, or the full sample in memory (per #5)?
11. What am I looking at when exporting data with "Enable DAQ"? The save dialog has file type set to .csv, but the result seems to have just one field stuck into really long lines (but still wrapped at some point). Are they just the converted voltage values with no indication of time scale? Forward or backward? Is there no way to get at the unprocessed integer sample data?
... it's a direct log of every single (averaged) sample that the software interface receives, in volts.
The time delta between samples depends on how you've set the sample averaging. For example, if you set the sample averaging to "100" under DAQ settings, and start the recording with the "Double Sample Rate" setting disabled, the time difference between each sample will be 1/3750th of a second. The samples are logged sequentially, with line breaks inserted every n samples so that it doesn't break people reading it back in Excel.
12. How is the frequency spectrum supposed to work? All I see is extra inputs for min/max frequency but nothing happens. UPDATE: on trying again now it works; no idea. But then when I turn it off, the scope time window seems to reset to some large, unseen value until I poke its input.
13. When I set a long time window like 10s, I see changes to the input slowly scrolling by as expected, but the precise shape of the signal is not steady, it "buzzes" like the background noise in a higher speed view that changes on each trigger. Is that just display aliasing because of too many samples or what?
14. In the source tree, is AVR_Code/USB_BULK_TEST the actual firmware code? Why that name? And how would one build it with avr-gcc, as the README suggests in place of Atmel Studio, since I'm not seeing any build script or Makefile?
Other comments
The program takes significant and variable time to start, from maybe 10 seconds to over a minute before anything shows up, CPU spinning. (Heck, now it's not starting at all after several minutes, whether the board is plugged in or not.)
It always crashes on exit (Windows reports "stopped working" with APPCRASH in Qt5Widgets.dll).
I've had it crash other times too, perhaps when trying to scroll something, not sure, haven't reproduced it consistently.
The scope range input widget gets out of sync with the display if you scroll it using the mouse.
The left/right keyboard commands don't work as documented for scrolling because they just move the cursor within whatever text input field is focused. Clicking the plot in hopes of focusing it doesn't help. Possibly similar for other commands.
I wasn't able to make much of the schematic(s), I guess because I don't have KiCAD around. A plain image or svg export might help.(ii) Good on you for at least including a ____BOM.csv (again with the odd names though) - this ought to be required labelling for electronic devices like ingredient statements on food products!
There's various cruft around the repository like binary objects, .bak files, an empty "test.txt" file and even several of the notorious MacOS Thumbs.db.